Hi. I'm Todd Vance.
I am a professional and hard-working actor and commercial model and this is my site.
Learn about what I've done
I am a professional and hard-working actor and commercial model and this is my site.
Learn about what I've done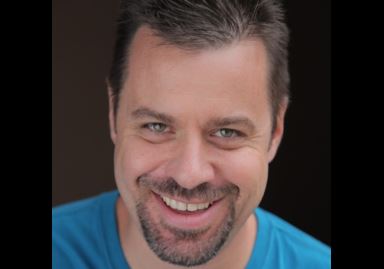
That's it
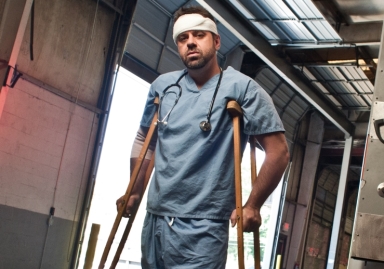
Photo shoot
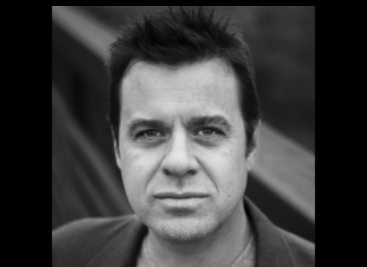
I'm the guy who dies...so sad
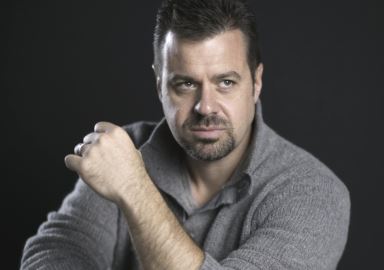
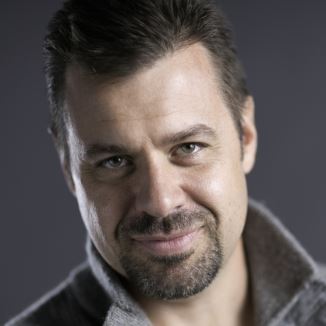
Need a brooder? I'm your guy
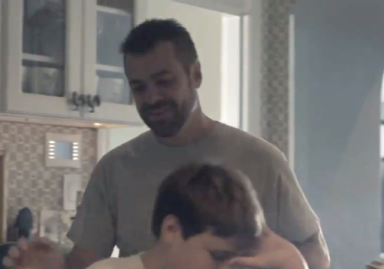
The beard CAN come off...if it has too. :(
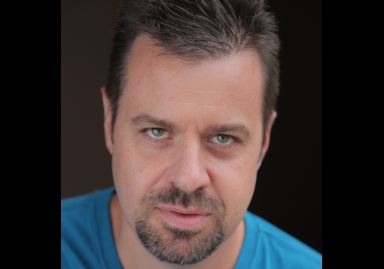
Really, I'm a nice guy
